Data & analytics studio

We build data products people trust.

DataView Analytics designs the dashboards, pipelines and real-time systems that turn raw numbers into clear, timely answers — from national election nights to everyday operational reporting.

A data analyst working at a screen in a city office
What we do ·Live results ·Dashboards ·Data pipelines ·Maps & geospatial ·Forecasting
Services

Everything between the data and the decision.

One team for the whole path — collecting and cleaning the data, engineering the pipeline, then designing the interface people actually use.

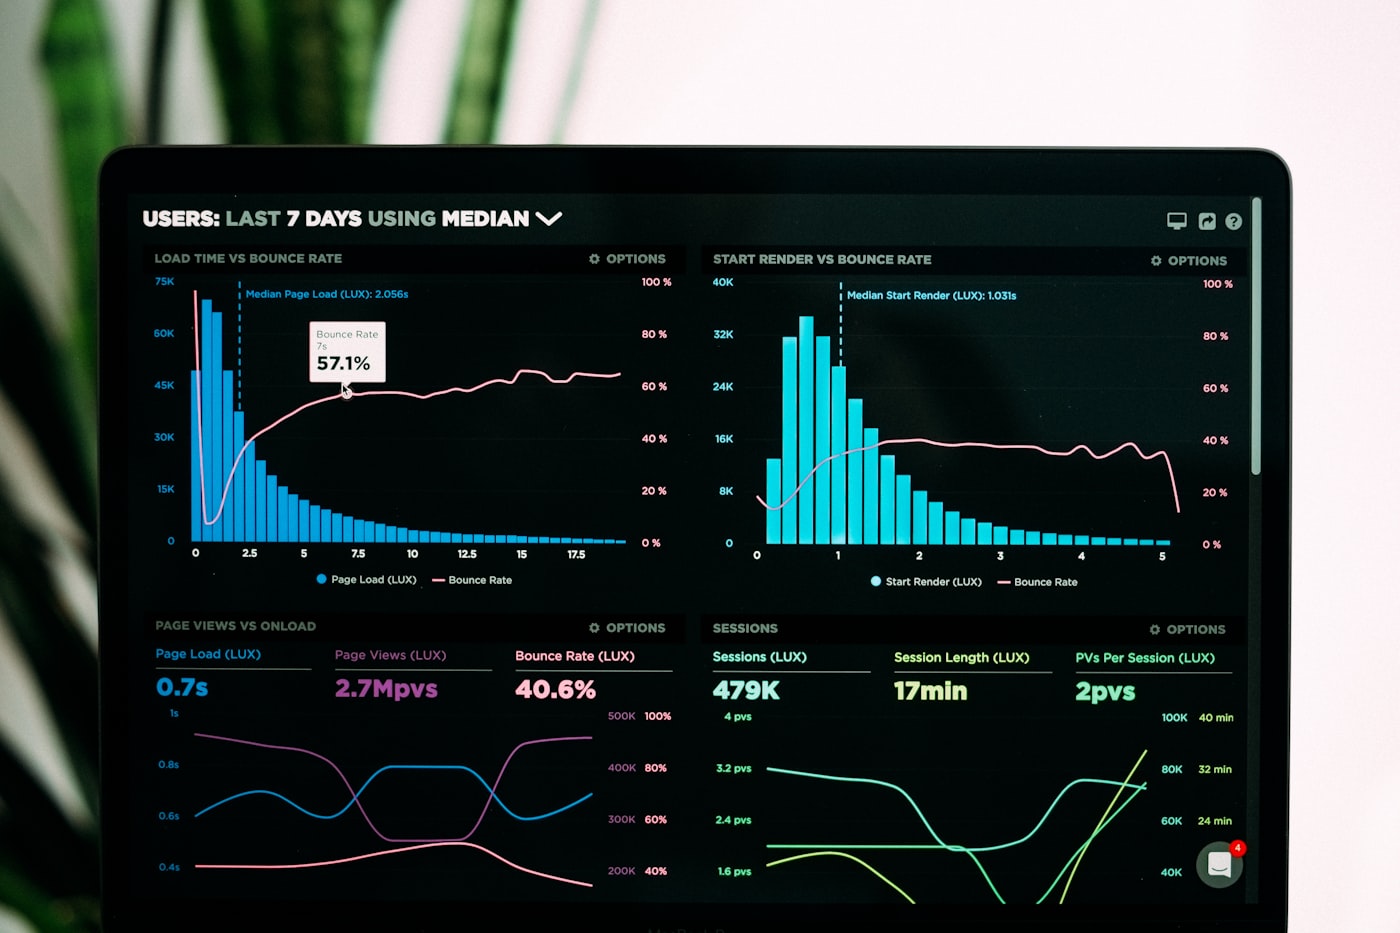
A live analytics dashboard with load-time, sessions and bounce-rate charts
01

Live dashboards & data apps

Real-time, responsive interfaces that hold up under an audience — election nights, launches, live operations.

02

Data engineering & pipelines

Ingestion, cleaning, validation and delivery — reliable feeds that keep dashboards fresh and correct.

03

Analytics & insight

Turning numbers into a narrative — the metric that matters, the trend behind it, and the caveats stated plainly.

04

Maps & geospatial

Choropleths, constituency maps and location analytics rendered fast and accurately, down to the boundary.

05

Real-time systems

Low-latency architectures with edge caching, so thousands of viewers see the same number within seconds.

06

Forecasting & modelling

Projections built only on what the data supports — honest ranges over false precision, always showing the working.

Sydney Harbour Bridge and city skyline with the Australian and Aboriginal flags flying
Based in Australia

Built here — for audiences that need answers fast.

Selected work

Built to be watched by a nation.

● Live case study

ZambiaDecides — 2026 general election, live.

A real-time results platform for Zambia's 2026 general election: the presidency, 226 constituencies and the first National Assembly under the 2025 amendments — with a live hemicycle, provincial breakdowns, a replayable archive of past elections, and a projection engine that only speaks once there's data to justify it.

  • Sub-15-second edge-cached results feed
  • Real province boundaries & register choropleths
  • Every figure traced back to an ECZ source
Visit ZambiaDecides
Approach

A short path from question to product.

A DataView analyst at work in the studio
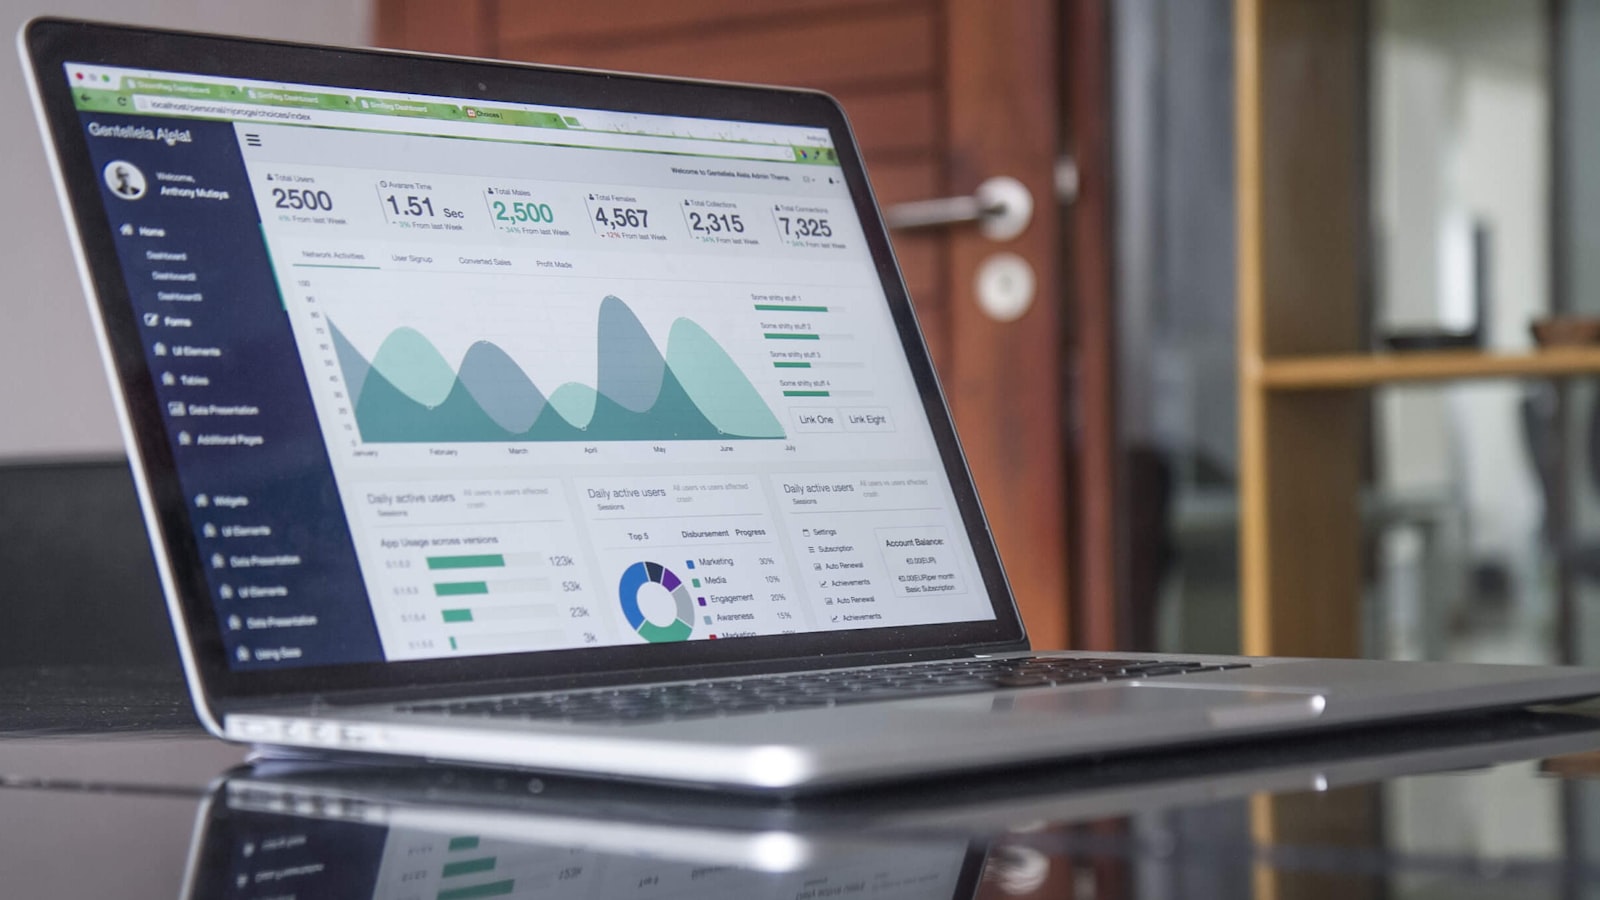
An analytics admin dashboard showing user metrics and charts on a laptop
01

Frame

We start with the decision you're trying to make, then work back to the data that serves it.

02

Engineer

We wire up reliable feeds — ingesting, cleaning and validating — so what's on screen can be trusted.

03

Design

We craft the interface: fast, clear, honest about uncertainty, legible on any screen.

04

Ship

We deploy, load-test for the big moment, and stay on hand while it's live.

Two DataView Analytics colleagues reviewing work together in a city office
About

DataView Analytics is an independent data & analytics studio. We build the tools that help organisations, newsrooms and institutions see what's happening in their data and act on it with confidence. We care about accuracy, about showing our sources, and about interfaces that respect the people reading them — because a number is only useful if it's believed.

Get in touch

Have data worth showing?

Tell us what decision you're trying to make. We'll show you what your data can say — clearly, and in time for it to matter.

info@dataview.com.au